Quick start
rball is a utility to store and interpolate instrument response matrices on the sky.
Creating a ResponseDatabase object
First we will use a demo database stored in an HDF5 file to create a response database.
[1]:
from rball import ResponseDatabase
from rball.utils import get_path_of_data_file

import h5py


%matplotlib inline

file_name = get_path_of_data_file("demo_rsp_database.h5")

with h5py.File(file_name, "r") as f:

    # the base grid point matrices
    # should be an (N grid points, N ebounds, N monte carlo energies)
    # numpy array

    list_of_matrices = f["matrix"][()]

    # theta and phi are the
    # lon and lat points of
    # the matrix database in radian

    theta = f["theta"][()]

    phi = f["phi"][()]

    # the bounds of the response

    ebounds = f["ebounds"][()]

    mc_energies = f["mc_energies"][()]

    rsp_db = ResponseDatabase(
        list_of_matrices=list_of_matrices,
        theta=theta,
        phi=phi,
        ebounds=ebounds,
        monte_carlo_energies=mc_energies,
    )
[WARNING ] The naima package is not available. Models that depend on it will not be available
[WARNING ] The GSL library or the pygsl wrapper cannot be loaded. Models that depend on it will not be available.
[WARNING ] The ebltable package is not available. Models that depend on it will not be available
[INFO    ] Starting 3ML!
[WARNING ] no display variable set. using backend for graphics without display (agg)
[WARNING ] ROOT minimizer not available
[WARNING ] Multinest minimizer not available
[WARNING ] PyGMO is not available
[WARNING ] The cthreeML package is not installed. You will not be able to use plugins which require the C/C++ interface (currently HAWC)
[WARNING ] Could not import plugin HAWCLike.py. Do you have the relative instrument software installed and configured?
[WARNING ] Could not import plugin FermiLATLike.py. Do you have the relative instrument software installed and configured?
[WARNING ] No fermitools installed
[WARNING ] Env. variable OMP_NUM_THREADS is not set. Please set it to 1 for optimal performances in 3ML
[WARNING ] Env. variable MKL_NUM_THREADS is not set. Please set it to 1 for optimal performances in 3ML
[WARNING ] Env. variable NUMEXPR_NUM_THREADS is not set. Please set it to 1 for optimal performances in 3ML
Examining the sky grid
We can view the grid in 3D. When a point in the sky is selected, a Delaunay triangulation is used to find the three matrices surrounding this point.
[2]:
rsp_db.plot_verticies_ipv(selected_location=[5, -45])
WARNING UserWarning: Message serialization failed with:
Out of range float values are not JSON compliant
Supporting this message is deprecated in jupyter-client 7, please make sure your message is JSON-compliant
Using and interpolating responses
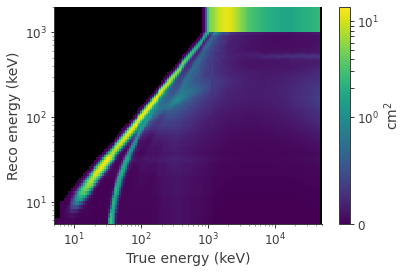
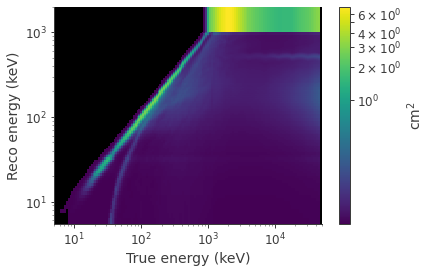
Internally, the ResponseDatabase is storing a 3ML InstrumentResponse object
[3]:
rsp_db.current_response.plot_matrix()
WARNING MatplotlibDeprecationWarning: You are modifying the state of a globally registered colormap. This has been deprecated since 3.3 and in 3.6, you will not be able to modify a registered colormap in-place. To remove this warning, you can make a copy of the colormap first. cmap = mpl.cm.get_cmap("viridis").copy()
[3]:
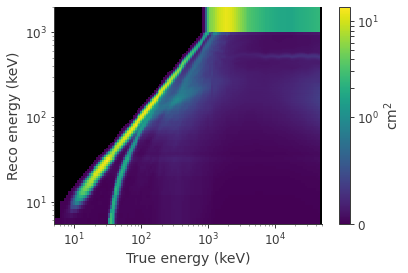
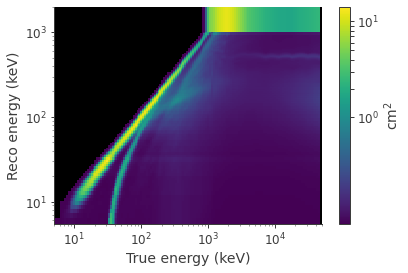
When we want to interpolate a matrix to a point on the sky, the encapsulating matricies (\(M_i\)) are found and the barycentered distances (\(b_i\)) withing the triangle is used to create an interpolated matrix (\(M_{\mathrm{intrp}}\)) such that
[4]:
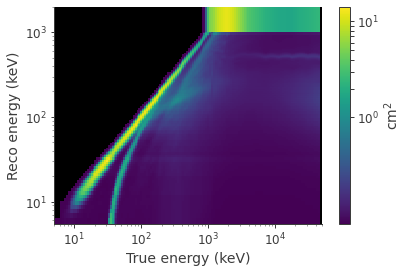
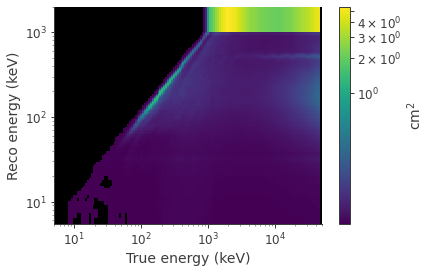
rsp_db.interpolate_to_position(0.0, 0)
rsp_db.current_response.plot_matrix()
[4]:
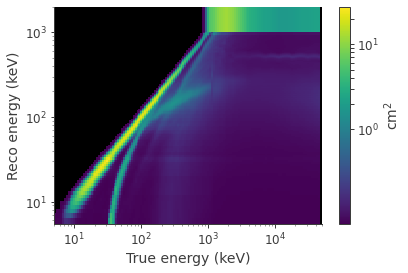
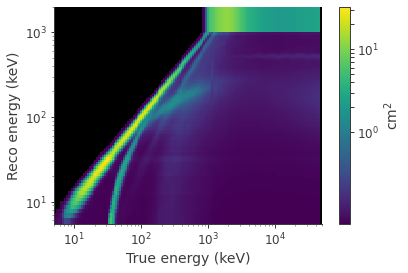
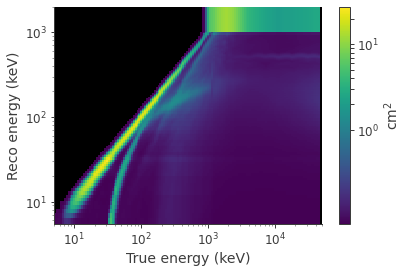
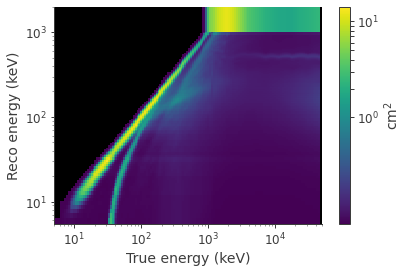
[5]:
for theta in range(-90, 90, 30):
    rsp_db.interpolate_to_position(0.0, theta)
    rsp_db.current_response.plot_matrix()
General notes on units and construction
The theta and phi coordinates are internally in radians, but all inputs are in degrees for the user. Moreover, both the plotting and interpolation assume inputs in J2000 RA, Dec coordinates. When subclassing ResponseDatabase, an private function should be defined (_transform_to_instrument_coordinates) which takes as inputs RA and Dec in degrees and transforms to the spacecraft coordinates of the response grid points resulting in a return of a theta, phi tuple in radians.
[ ]: